Jables' Map Cattle Log
Monday, November 18, 2013
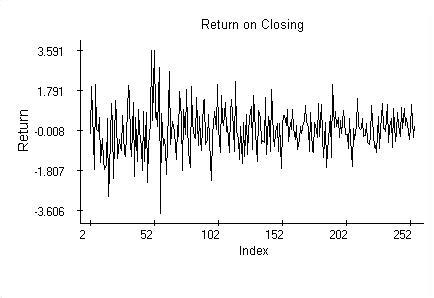
Index Value Plot
http://www.eminf.com/marketpred.html
An index value plot is a type of visualization map that shows and index value rather than an absolute value plotted on a line graph. This index value plot is meant to show the return values computed from closing numbers.
No comments:
Post a Comment
Newer Post
Older Post
Home
Subscribe to:
Post Comments (Atom)
No comments:
Post a Comment