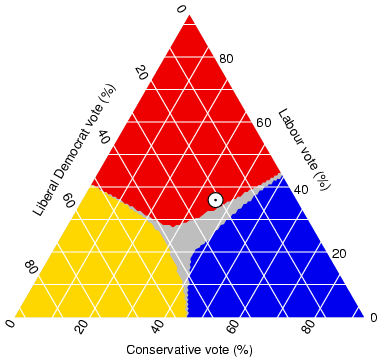
Triangular plots are also known as ternary plots and they are comprised of three different variables that added together equal a constant. They are most often used in sciences to represent compositions of systems composed of three species. This diagram is meant to represent the presumed votes for a parliamentary election.
No comments:
Post a Comment